About Me

My photo
Native Californian, biologist, wildlife conservation consultant, retired Smithsonian scientist, father of two daughters, grandfather of four. INTJ. Believes nature is infinitely more interesting than shopping malls. Born 100 years too late.
Showing posts with label data analysis. Show all posts

Sunday, March 28, 2010

Seven months at Chimineas: habitat differences, species accumulation and discussion

Not the most commonly photographed mammal, 
but one we could always identify.

This wraps up the analysis of the preliminary data collected by Craig Fiehler and me at Chimineas Ranch.


You'll be relieved to know that the next post will be usual fodder.


Number of species by habitat: The number of vertebrate species recorded in each habitat differed, with Blue Oak Woodland, Mixed Chaparral, and Annual Grassland having the largest numbers of species. 


The number of mammal species also differed among habitats, and the order of abundance was similar to vertebrates in general except in Mixed Chaparral and Annual Grassland where the number of species was the same.


The differences in species numbers among habitats probably reflect uneven camera trapping effort among habitats, because species numbers and camera trapping effort have a correlation coefficient of 0.712. 


Species accumulation over time: A pronounced stepwise distribution emerged when we plotted the cumulative number of species during successive weeks of the survey.  The addition of 6 to 21 new species took place during weeks 1, 15, and 36, which coincided with camera deployment in new locations. Single species additions during successive weeks took place at the beginning and end of the 6-month survey.  The stepwise pattern is unusual and probably a response to the appearance of bait at new locations.   Gradual growth of the curve during recent weeks indicates that more additions can be expected, whereas a plateau indicates stasis.  


Similar patterns of stepwise and gradual increases can be seen in separate curves for mammals and birds.


The stepwise accumulation of bird species took place at Poison Water Spring during only 8 days before the memory stick was filled. Large numbers of birds watered there in the morning and late afternoon.


Discussion and Conclusions

Camera performance: Camera performance was adequate, but false triggers and/or battery depletion and occasional camera failure significantly shortened the effective sampling periods.  This is unavoidable because of the vagaries of PIR sensor technology. Active infra-red or laser sensors would be preferable for 24-hr sampling, though the external electrical wiring needed for these systems has inherent shortcomings, not least of which is its attraction to rodents which chew the wires.  24-hr camera sets in open-sky situations quickly filled the memory with false images, but high percentages of false triggers also took place in partially shaded areas. 

In such situations we revised our practice and set cameras for night-time sensor detection. Rodent activity was the primary factor contributing to false triggers at night, and this is clearly an unavoidable response to bait.


It is desirable to reduce false triggers by judicious use of the night-time setting in partial shade and open sky situations. Where direct sunlight was absent, or limited for brief periods early in the day such as rock recesses, grottos, or large overhangs, PIR sensors worked very well, and captured excellent daytime portraits of coyote and a napping gray fox, and night time images of bats in flight.


Photo frequency trends: The use of baits undoubtedly increased the probability of detecting many species of mammals, with rodents showing a marked numerical effect during the first week. Photo frequency peaked on the night 4 but by night 8 had subsided to an oscillating baseline level. Carnivores on the other hand were attracted to the canned mackerel throughout the sampling period, and coyotes approached it even after two months by which time the odor of canned fish had become an overpowering stench.


These differences indicate that we need more data to discern species differences in response to camera trap baits.


Survey effort: To date survey effort has been uneven across the seven habitats. Differences in habitat selection among carnivores are well documented. We need to increase survey coverage in under-represented habitats such as coastal scrub, desert riparian and juniper woodland in all seasons.


Four species of carnivores (coyote, gray fox, bobcat and black bear) were detected in the first eleven weeks of the survey, and the kit fox appeared on week 20. However, two normally abundant species were not detected.


The absence of striped skunks is unexpected because they are habitat generalists and respond readily to a wide variety of baits. Local extermination due to epidemic disease such as rabies seems unlikely, because contagion would likely have reduced populations of other carnivores (Carey and McLean 1983).


The absence of raccoons is also unexpected but may be explained by the small number of sets that were made in the vicinity of water.


The undetected status of ringtail and spotted skunk may be due to their patchy distribution in the region. Spotted skunks in Texas were found in older mesquite habitats (Neiswenter and Dowler 2007), and throughout their range they tend to occur in canopied or brushy habitats. These researchers found spotted skunks to be “more specialized in their coarse-grained utilization of habitat during foraging than striped skunks”, but they did cross open expanses less than 100 m to reach other patches of mesquite.


If present on Chimineas, spotted skunks may be found in more densely vegetated habitats such as coastal scrub, closed juniper woodland and mixed chaparral.


With few exceptions, mustelids are characteristically less often encountered than many other carnivores. Low densities and largely exclusive home ranges of badgers and weasels may explain their lack of detection. We expect continued sampling in grassland habitats, especially with active colonies of ground squirrels to reveal these species.


Finally, we made special efforts to detect ringtails by placing cameras in steep rocky areas and bluffs, but to no avail. The species is widespread in California and where it is most abundant in the Sacramento Valley it is often found in rimrock and bluffs bordering creeks and rivers (Orloff 1988). Though Orloff cites but two records of ringtails in San Luis Obispo County, they will likely be found in canyon riparian situations.


We will continue the survey through 2010 and intensify our efforts in underrepresented habitats.


Acknowledgements
Many thanks to Bob Stafford, Senior Cal Fish & Game Wildlife Biologist and Director of Chimineas Ranch for permission, enthusiasm and assistance in pursuing this study. 


References
Carey, A.B. and R.G. McLean. 1983. The Ecology of Rabies: Evidence of Co-Adaptation. Journal of Applied Ecology, Vol. 20(3):777-800.


Neiswenter, S. A. and R. C. Dowler 2007. Habitat Use of Western Spotted Skunks and Striped Skunks in Texas. Journal of Wildlife Management, 71(2):583-586.


Orloff, S. 1988. Present distribution of ringtails in California. California Fish and Game, 74:196-202.

Thursday, March 25, 2010

Seven months at Chimineas: survey effort, habitat coverage, and species occurrence


Here's the second installment about our camera trapping findings at the Chimineas Ranch.

Survey effort over time: Camera trapping effort increased as more cameras became available during the survey.   Effort was doubled during the latter half of the survey (October, November and December).


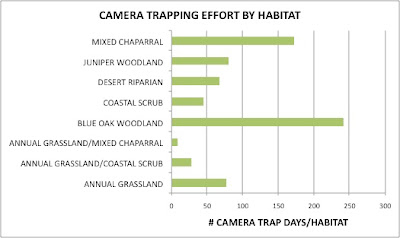
Survey effort and habitat coverageCamera trapping effort as measured by camera trap days differed in the 8 habitats, with Blue Oak Woodland receiving the greatest effort, and Coastal Scrub receiving the least.  The remaining three habitats, Juniper Woodland, Desert Riparian, and Annual Grassland and its variants received sub-equal camera trapping effort.


Species occurrenceWe recorded 21 species of mammals, which represent 44.7 % of those known or expected to inhabit the area.  We recorded 5 of the 12 carnivore species expected to be present, which accounts for half of the mesocarnivores. Representatives of the skunk, weasel, and raccoon families were not detected. Note that the high number of coyotes is inflated by the inclusion of photos at the cow carcass.  When these are removed the coyote ranks 4th in numbers (n = 157).


Twenty-six species of birds were also recorded, which represents a much smaller proportion (14.6%) of those known to be present on the unit.  Ground foraging birds were among the most commonly recorded species, and carrion feeders were photographed only at the cow carcass. 


Finally, Western fence lizards (4), Pacific tree frogs (6), and Western toads (23) were incidentally photographed at Poison Water Spring. 

We're still not finished.

Don't want to waste any data, you know.

Tomorrow should wrap it up, then a brief discussion. 


Wednesday, March 24, 2010

Seven months at Chimineas: camera performance and photo frequency trends


Camera Performance: Cameras were deployed for 1141 days (# cameras x number of days deployed). They were in operation for 723 days, or 42.3% of the days they were deployed. False triggers during 24 hr sets were usually responsible for the disparity. False triggers often filled memory cards to capacity and/or drained batteries in a few days.

68% of all photos from 21 comparable 24-hr sets (partial shade to open sky) were probably due mostly to heat-induced false triggers. The range was from 1.5 – 100%. False triggers probably due to rodents accounted for 58% of the photos from 6 night-time sets (range = 17.6 – 69.6%).

A total of 6965 photos were taken. 2977 of these (43%) contained vertebrates (including multiple species). This is equivalent to an overall 2.7 animal photos/24 hr.

Nocturnal versus diurnal activity: We tabulated the number of day and night visits for the 5 carnivores using data from 15 24 hr sets. The sample size is small but shows that with the exception of black bear most visits were nocturnal.


Photo frequency trends during sampling periods: The frequency of photos was not evenly distributed during sampling periods. At many sets more photos were taken during the first week.


Since this could be due to the greater number of cameras in operation during the first week, we plotted the mean number of photographs for rodents, and the trend was still evident.


To determine if this was a response to bait we plotted the mean number of bat photos per day at sets used as night roosts. Bait is not an attraction to these insectivorous bats. The correlation coefficient of 0.073 was low, and the slope was reduced.


The disappearance of bait is the most likely explanation for the declining visitation rate of rodents and also perhaps for some mammals other than bats.

Neither coyote nor bobcat showed the distinctive decline in photo frequency shown by rodents.

The daily distribution of visits by coyotes however shows a different pattern. At 10 camera sets low visitation prevailed most of the time, and highest visitation peaked between weeks 2 and 3. This is what Larrucea and her co-workers found: coyotes don't rush in to visit new cameras.


Bobcats showed two peaks of visitation during the first 2 weeks, but the pattern is not well defined.


Visitation data will increase in the coming months, and differences among species should become clearer.

Still awake?

Hey!! Don't tune out yet!

More graphs are coming, and after that you get to see photos from the cameras Craig just checked (including a new carnivore!).


Friday, June 8, 2007

Five months of Mossy Rock visitors


It's been seven months since I cabled the camera trap to a bay tree next to the mossy rock. Why have I left it there so long? The pumas are the reason. I thought they might return, and they did. But a lot of other animals passed by too.

Before I go any further, however, I have to confess that this was not a scientific experiment. If it was, I would have controlled my own impulses to attract animals to the site. On the contrary, my own flights of fancy introduced a lot of confounding variables -- like the different baits and lures I used to attract photographic subjects.

The camera has been in operation most of the time--164 days (or 5.4 months out of 7 months)--and it's still there. I lost a couple weeks of data due to downloading errors, and a few interruptions were due to battery failures and temporary dementia resulting from over-excitement. (The latter happens when I get pictures of pumas, and I forget to switch the mode from "View" to "Photo". You should see me cursing myself when I return a week later and find that the camera was in view mode.)

Back to the data. During the sampling period the camera took 588 pictures, 79% of which were images of 17 species of birds and mammals. Not a bad success rate.

Now let's start the drum roll and focus on the graph at the top of the page . . .

As you can see, the winner of the most commonly photographed animal is . . . . THE DEER MOUSE (huzzaaah)!

However, if I hadn't scattered sunflower on the rock I am not sure mice would have accounted for 45% of the photos. Sometime in February I got the bright idea that baiting deer mice would attract the screech owl, and I started to fantasize about photos of owls gripping deer mice.

Spotted skunk (29), wood rat (26), puma (24), and squirrel (24) were the next most commonly photographed species, followed by gray fox (19). All other species, including all the birds, were photographed from one to 8 times.

Camera traps are commonly used to inventory wildlife, and especially mammals. Plot a species accumulation curve and often you find that the number of species photographed rapidly increases at first, and then decreases.


In this case, 70% of the 17 species showed up in the first 58 days. But a long time must pass before you stop getting the occasional new species. You may think you know what's there, but sooner or later something new shows up. I know that opossums, coyotes, raccoons, long-tailed weasels, and otters occur in the area, but not one visited the mossy rock.

Camera traps are a useful inventory method, but they have their limitations. Some species are highly selective in their use of habitat, avoid strange objects such as cameras, or may only be attracted to special baits and lures. To photograph these species you have to know where and when to look, and how to attract them. If you are working in a unknown area, and don't know what to expect, you have to explore all habitats thoroughly.

Even then, you need to rely on a number of different methods, and consult with local people. They usually have a very good idea of what's around. I now consider myself one of them, and can tell you with confdence who visits the mossy rock.

Sunday, December 31, 2006

A year of camera trappin'


Luck--or being at the right place at the right time accounts for some success, but not all success. I wanted to measure my camera trapping success under different conditions. After all, who wants to trudge through cold rain and mud only to find 20 exposures without critters. It’s like the Earth Goddess forgot to put your packages under Nature’s Christmas tree. So it's time to summarize the many days I squandered in the woods (when I could have been doing something useful, like raking leaves or cleaning gutters).

On a spreadsheet I recorded:
a) the amount of time the cam was available to photograph wildlife,
b) the location (a trail in the woods, a clearing, a water hole), and
c) the attractants used (bait, scent, scat, etc.), if any.

The cameras captured images of 14 species of mammals and one mammal I couldn't identify. This is a highly biased selection, because once an animal gave me a lead, I usually targeted the critter for pictures. Some species were easy to photograph. Foxes, skunks and rodents were attracted to baits, while ringtails and bobcats were not as vulnerable. Deer commonly use trails through the woods, but I wasn't after deer. I find it a little odd that there weren't more pictures of raccoons. And how come I'm not getting coyotes? The neighbors say 10 years ago they howled all night. Have they all been trapped out? The most unexpected picture was the shrew. Pure chance! The biggest thrill was the ringtail and puma, and the bear was gratifying after the ordeal it put me through.

Apologies to my ornithological friends. I never tried to photograph birds, but I got their pictures anyway. Jays, ravens and titmice were all attracted to sunflower seeds, but the hermit thrushes were a surprise. They were the most common visitor to one small waterhole deep in a ravine, where they seemed to be feeding on aquatic insects. (If there was a way to get closeups with these cameras I could get interested in taking pics of dicky birds).

SUCCESS RATE
I defined success rate as # of photos with animals divided by the total # of photos.

Total # of camera-trap-days: 755
Total # pictures: 2085
Total # animal pictures: 1060
Overall success rate: 50%
Range of success rate:
by camera: 20% to 90%
24 hr vs night: 33% vs 74%
unbaited sets: 22% (24 hr), 73% (night)
meat sets: 44% (24 hr), 79% (night)
waterhole sets: 72% (24 hr)
seed bait sets: 38% (24 hr), 74% (night)

WHAT DOES IT MEAN?

NUMBER OF CAMERA TRAP DAYS: From Nov 13, 2005 to year's end 2006 I had anywhere from 1 to 5 camera traps in operation. I used 5 cameras: a Cuddaback, an Olympus 390, two Olympus 360Ls, one Sony P32, and 5 Sony s600s. (The Cuddaback is commercial, the others are "homebrews", hacked by the codger himself). I didn't run traps all year long. So the sample size could have been larger.

CAMERA DIFFERENCES: There were differences between cameras in the time required to fire up when the PIR first detects "moving heat. I didn’t compare cams because the sample size was small in some cameras, and there were too many uncontrolled variables. When I adopted the Sony s600, I stopped using the others. The s600 doesn’t fire up as fast as the p32 and P41, but the 6 MP pictures are a compensation. The biggest improvement for me was the production of the new Trail Mode chip for the Pixcontroller board. It allows rapid succession of exposures. Once activated the camera remains on for another 30 seconds after each PIR event. This allows the camera to rapidly fire like a paparrazo. That’s exactly what I want—a camera that takes as many pictures possible as long as the animal is present. "I don't want no schtinkin' minimal interval of 1 minute between pictures."

24 HR VERSUS NIGHT MODE: At many camera sets where the sun reached the ground the sensor detected warm moving air and triggered the camera. False triggering explains the different success rates of the 24 hr and night modes. I got fewer false triggers in night mode.

BAITED VERSUS UNBAITED CAMERAS: Bait almost always increased the number of animal pictures (success rate). Presence or absence of bait seems to have made little or no difference at night. This seems odd, and may be an artifact. I need to look into this next year.

CONCLUSION: My highest success rates came when I used bait, and set the mode for nocturnal shots only. Isolated waterholes attracted birds and mammals just as well as bait does, and 24 hours a day at that, though bears never bathed or drank at night. But I failed to photograph a number of mammals that I know are here. I'll sample more habitats this coming year, and experiment with different kinds of lures. My colleagues and I are also talking about teaming up to do an experiment on the effectiveness of different attractants.